Section 3: Advanced Topics
Creating a Workbook Script
The workbook script is a powerful Dodeca feature used in spreadsheet based views. It enables the administrator to define logic that is in response to a specific user-triggered event without the need to write complicated code. The following section provides a step by step tutorial on creating a workbook script. In this example, the defined logic is a run calculation that the specific event of using the Essbase send function triggers. Additionally, the run calculation becomes the event when it triggers a text box stating that the calculation is complete.
The following section provides step by step instructions for completing a simple workbook script procedure.
In the Dodeca Administrators Console, select menu:Admin[Views]. Open the Income Statement view.
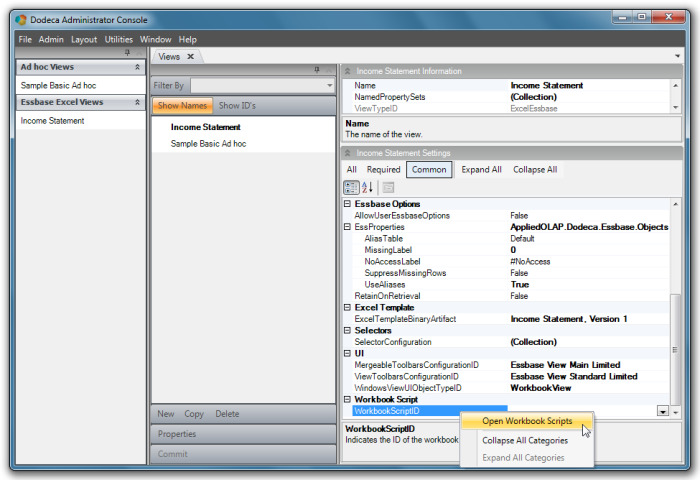
Scroll down to the bottom of the properties. Highlight, and then right click on the WorkbookScriptID property. Click Open Workbook Scripts and the Workbook Scripts metadata editor opens.
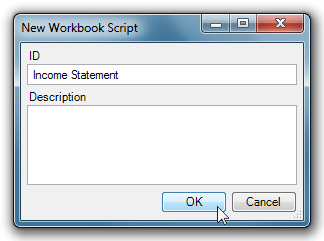
Click New. The New Workbook Script dialog displays. Type Income Statement in the ID box and click OK.
| The Income Statement ID/Name has been used throughout the tutorials for simplification purposes (Excel Template, Binary Artifact, Essbase Excel View). These features (including the new Workbook Script) are not required to have the same, or even similar, names to each other. The Income Statement Workbook Script is not specific to the Income Statement View and could be added to other views. |
Creating a New Procedure
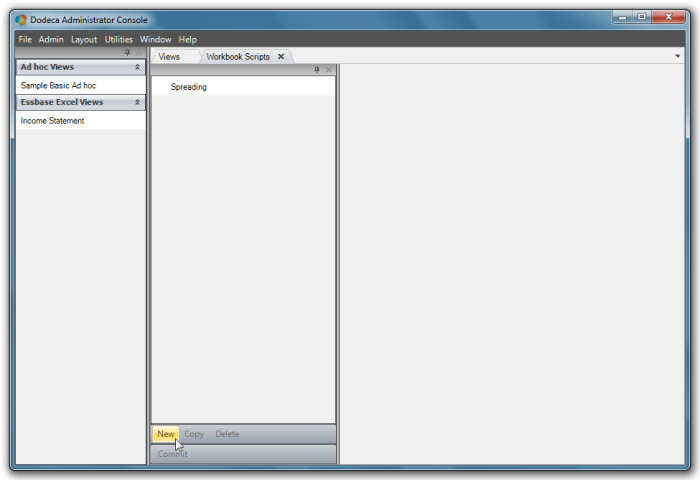
The Income Statement Workbook Script displays.
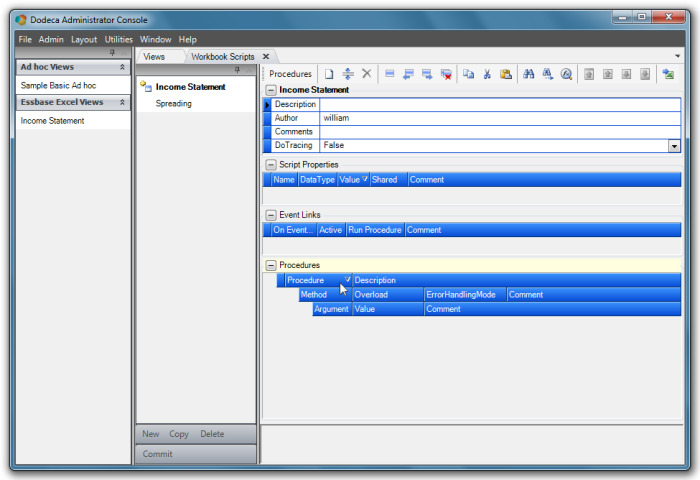
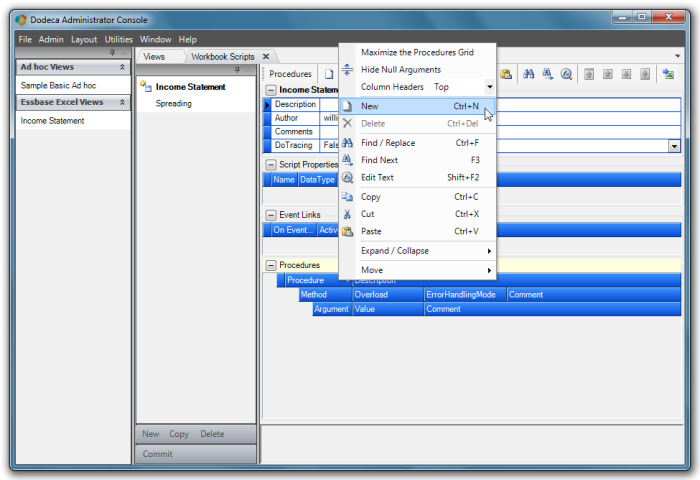
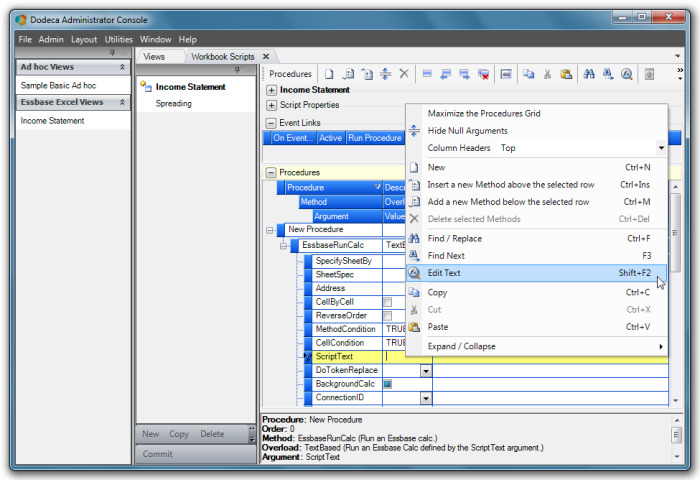
Right click on the Procedures column to display a menu. Click New to create a new procedure.
Adding a Method
The new procedure opens the Method selection menu. There is a broad range of common methods to choose from. In this case, select EssbaseRunCalc for the method.
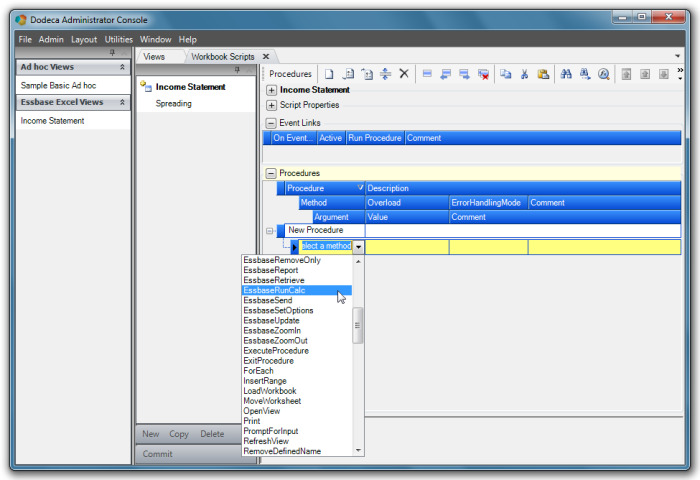
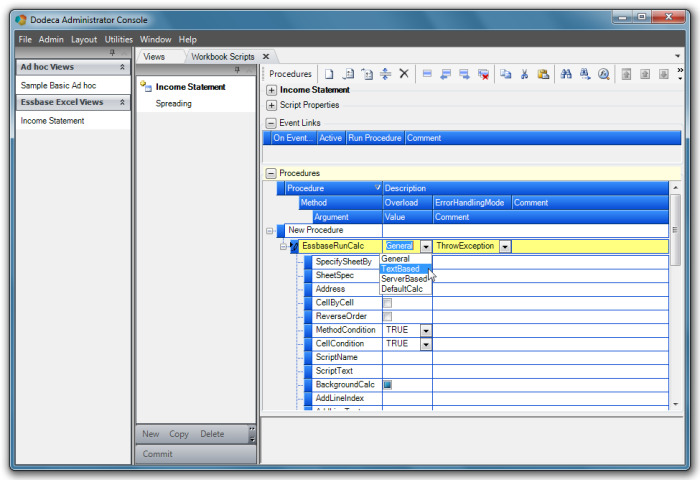
In the Overload column (immediately to the right of the Method), select Text Based from the menu.
Adding Script Text
Right click on the ScriptText Value field and select Edit Text from the context menu.
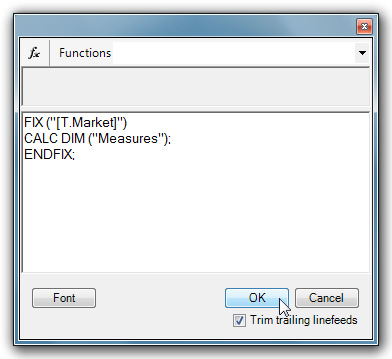
Type the desired script in the Edit Cell Text dialog and click OK. In this case, use the script shown in the following screenshot.
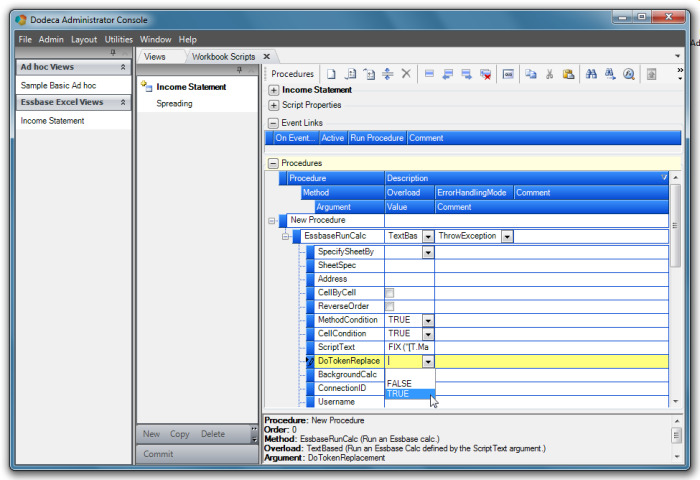
Scroll down and set DoTokenReplacement to TRUE. This setting associates the Tokens in the script with the values of the selectors they are named for (Market, Measures). Now the calculation in the procedure will compute those specific values as they are found in a view rather than a meaningless Token value.
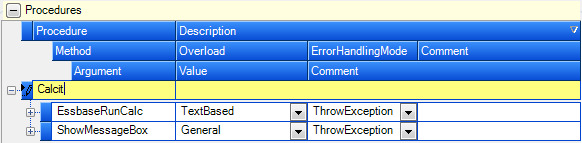
The Essbase Run Calc method is now complete and added to the Calcit Procedure.
You can add other methods to expand on the procedure. For purposes of this tutorial, a message box that displays after the calculation will indicate the Workbook Script and tool are working.
To add a message box to the procedure, highlight and right click on the EssbaseRunCalc method row. Click Add a new Method below the selected row option from the dialog menu.
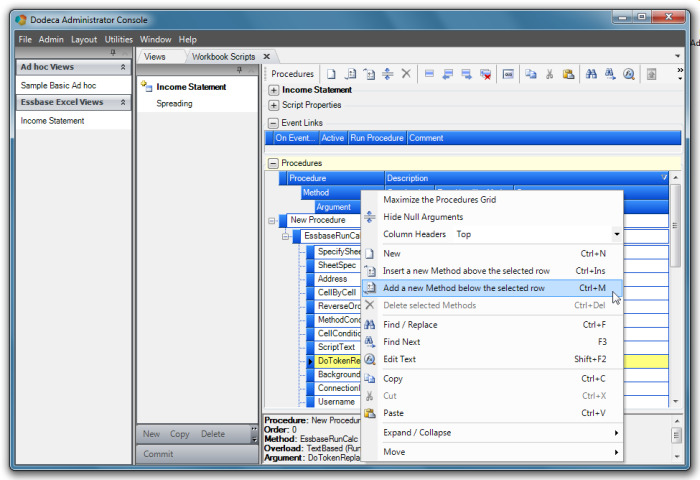
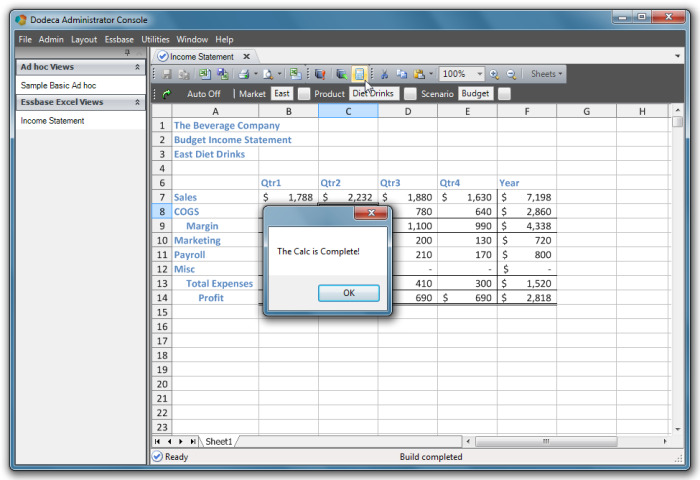
A new row displays below the EssBaseRunCalc method. Selecting ShowMessageBox from the menu displays options in the row labeled Message; type in The calc is complete!
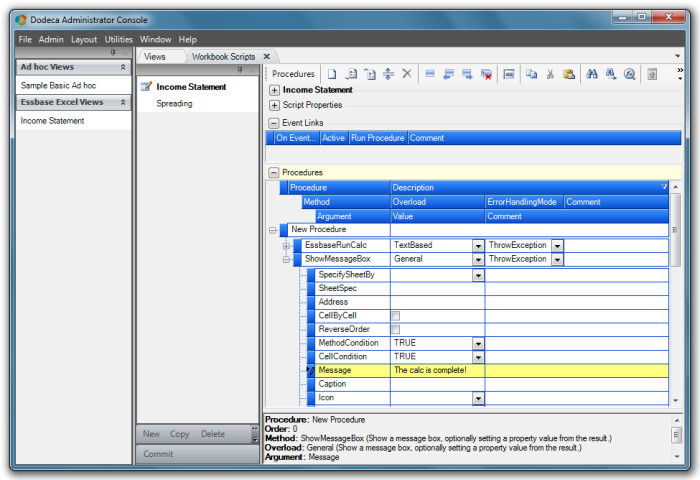
The EssbaseRunCalc method is now followed by a message box letting the user know “The calc is complete!”.
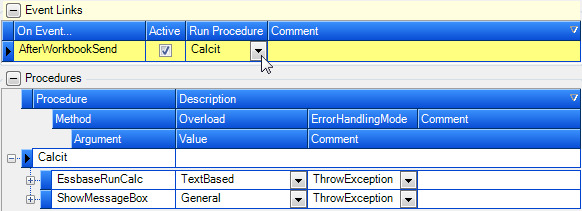
To rename the procedure, simply highlight the New Procedure text and type in the new name (in this case, Calcit).
To define when the procedure runs, right click the On Event row to display the menu and select New. Select AfterWorkbookSend in the On Event column. Make sure it is active and select the new procedure Calcit from the Run Procedure menu. This prompts the run calculation procedure to initiate after the Essbase Send function has been performed.
To save the new procedure, click Commit in Workbook Scripts.
To assign the procedure to the Income Statement view, open the Views metadata editor and the Income Statement view. Scroll down and make certain that Income Statement is selected in the WorkbookScriptID property and click Commit.
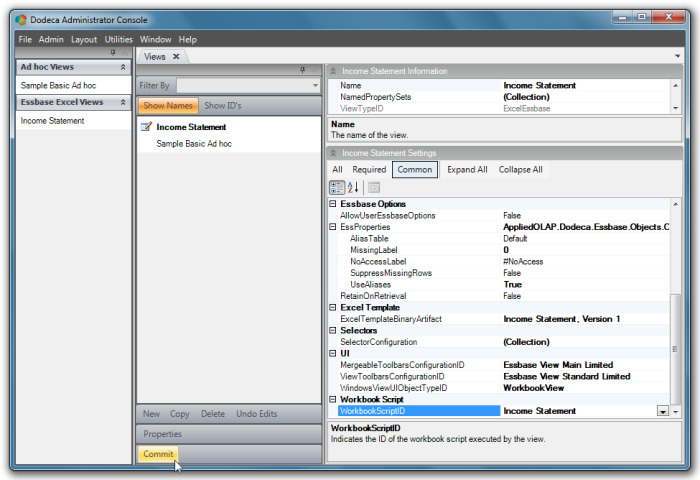
The procedure is now complete and ready to be used in the Income Statement View.
To test the procedure, open Income Statement from the view selector menu. Make sure the Selectors are filled and build the view.
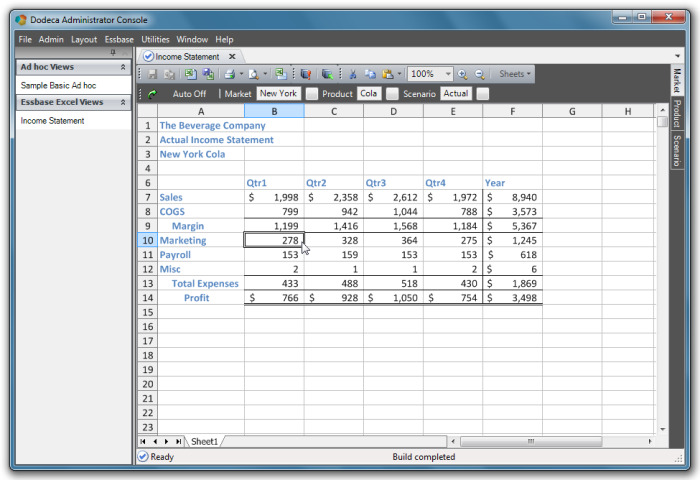
Make a change in the data and click on the send icon in the toolbar.

After the send is complete, the message box should display and a Calc Completed message displays at the bottom of the screen.
If the procedure does not run after the build, check the error details for clues. The most likely cause would be a missed character or space in the short script (see page 93) written for the Essbase Run Calc. Open the Workbook Script metadata editor and the Income Statement view. Expand the Calcit Procedure and the EssbaseRunCalc method. Scroll down to the Script Text row and check for errors. Correct any errors and commit the changes. Re-open Income Statement from the view selector menu and repeat the build and send procedures.
Understanding Events in the Life of Essbase Excel View
An Excel Essbase view has a very eventful life. Whenever something significant is either about to happen or has happened, the view notifies anyone who is interested. The notifications are each referred to as an event.
Workbook scripting provides a mechanism for listening and responding to a view’s events. A workbook script event link is used to respond to an event by way of a procedure, which is automatically executed when the event occurs. The procedure consists of one or more methods, each of which performs some action within the context of the event.
Some events have event arguments that provide information about the event context. For example, the BeforeRangeRetrieve event has two arguments: SheetName and RangeName. The workbook script @EPVal(<PropertyName>) function can be used to get the value of an event argument, such as @EPVal(RangeName) to get the name of the range being retrieved.
In the following sections, the events that occur when a view is opened, built, and closed, as well as when operations are performed, are listed and described, including any event arguments associated with the event.
-
Events that occur before something significant is about to happen allow the workbook script to cancel whatever is about to happen. The CancelEvent method can be used to prevent the default behavior or processing from continuing. This is referred to as _cancelling the event.
Events on Open
When an Excel Essbase view is opened, the following events occur:
Event 1: AfterConstruct
Description
This event occurs after the view metadata creates the Excel Essbase view instance and before the view user interface is created and initialized.
Remarks
This event provides the opportunity to set view properties, such as adding or editing view tokens, before the view’s user interface is initialized, including selectors.
Most of the view’s properties can be edited from a workbook script using the SetViewPropertyValue method.
To add or edit a view token during the AfterConstruct event, use the View overload of the AddToken method. This is equivalent to editing the view’s ViewTokens property in the View metadata editor.
It is actually quite rare for a workbook script to use the AfterConstuct event link, but when needed, it provides a way to edit view properties before any of the settings are used.
Events on Build
When an Excel Essbase view is built, the following events occur:
Event 2: BeforeWorkbookClose
Description
This event occurs before the current workbook is closed.
The view can be thought of as a workbook that contains one or more sheets. Even before the first time the view is built, the workbook contains a single empty sheet. Since the view can be built many times, the workbook is closed during the build processing to restore the view to the initial state. Closing the workbook actually removes all the sheets except for the first sheet, which is cleared of values, formulas, and formats.
Event 4: BeforeTemplatePullToClient
Description
Even though the Excel template is actually only pulled from the server to the client the first time the view is built or the next time the view is built after the template has changed, this event always occurs before the check is performed that determines whether the template already exists in the client cache and, if so, whether the template needs to be updated.
Remarks
This event can be cancelled, which cancels the build processing. As with cancelling the BeforeBuild event, the status bar should be updated by the workbook script.
This event can be used to dynamically control which Microsoft Excel template is used for the view. To do so, use the SetViewPropertyValue method to set the ExcelTemplateBinaryArtifact.ID and ExcelTemplateBinaryArtifact.ID values.
Event 6: BeforeWorkbookOpen
Event 8: BeforeCascadeSheetsBuild
Event 9: BeforeCascadeSummarySheetBuild
Event 11: BeforeWorkbookRetrieve
Description
This event occurs before the retrieval of Essbase data begins for the entire workbook. The view’s RetrievePolicy property determines whether all sheets, only sheets that contain one or more named retrieve ranges, or only the active sheet is retrieved.
Remarks
Cancelling this event bypasses the default retrieve behavior.
This event provides the opportunity to modify the view content before the Essbase retrieve(s) occurs or to intercept the processing with logic implemented by the workbook script.
For each sheet that is retrieved, as determined by the view’s RetrievePolicy property, the following events occur:
Event 12: BeforeSheetReplaceTokens
Remarks
Cancelling this event bypasses the default token replacement behavior for the sheet.
Since the sheet cannot be assumed to be the active sheet, any workbook script method called within the context of this event that applies to the sheet should set SpecifySheetBy to SheetName and set SheetSpec to @EPVal(SheetName).
Event 14: BeforeSheetRetrieve
Description
This event occurs before the data is retrieved for all of the Essbase retrieve ranges on the sheet, or if no retrieve ranges exist, for the used range.
Remarks
Cancelling this event bypasses the default retrieve behavior for the sheet.
This event provides the opportunity to modify the sheet content before the Essbase retrieve(s) occurs or to intercept the processing with logic implemented by the workbook script.
Since the sheet cannot be assumed to be the active sheet, any workbook script method called within the context of this event that applies to the sheet should set SpecifySheetBy to SheetName and set SheetSpec to @EPVal(SheetName).
For each retrieve range on the sheet, or if no retrieve ranges exist, the following events occur for the used range:
Event 15: BeforeRangeRetrieve
Event Arguments
SheetName is the name of the sheet that contains the range.
RangeName is the name of the retrieve range. If the used range is being retrieved, the range name is empty.
Remarks
Cancelling this event bypasses the default retrieve behavior for the range.
This event provides the opportunity to intercept the processing with logic implemented by the workbook script.
Since the sheet cannot be assumed to be the active sheet, any workbook script method called within the context of this event that applies to the sheet should set SpecifySheetBy to SheetName and set SheetSpec to @EPVal(SheetName).
Event 16: AfterRangeRetrieve
Event Arguments
SheetName is the name of the sheet that contains the range.
RangeName is the name of the retrieve range. If the used range is being retrieved, the range name is empty.
Remarks
Since the sheet cannot be assumed to be the active sheet, any workbook script method called within the context of this event that applies to the sheet should set SpecifySheetBy to SheetName and set SheetSpec to @EPVal(SheetName).
This concludes the events that occur for each range on the sheet.
Event 21: AfterBuild
Remarks
This event can be cancelled, which is not typical for an event that occurs after something has happened. This allows a workbook script to cancel the build after the processing based on the content of the view. For example, if the view does not contain any data, the workbook script can cancel the event, so the view remains covered.
Using Relational Data with SQL Excel and Essbase Excel Views
Relational Data
The SQL Excel and Essbase Excel view types support the ability to display relational data as rows in a spreadsheet. Users can edit the data in the spreadsheet, and then write the changes back to the database. The view content can contain data from multiple tables within a single database or from across multiple databases. The databases can be the same or different types, such as Oracle and SQL Server, as well as different versions of the same database type.
The following capabilities are supported for both the SQL Excel and Essbase Excel view types:
- Relational write back
-
In addition to presenting relational data in a view, you can optionally allow users to add, delete, and edit the data.
- Multiple levels of row groupings and sorting
-
Define one or more levels of row groupings with each level of grouping or sub-grouping based on a single column, multiple columns, or filter expressions, which are conditional statements.
- Excel grouping and outlining
-
Optionally enable Excel outlining for any or all levels of row groupings.
- Cascading
-
Cascade relational data based on one or more selectors. A view can also include non-cascade sheets that contain relational or non-relational data.
- Excel Support
-
Leverage Excel capabilities for use with the relational data, including formulas, formatting, freeze panes, and sheet-level protection.
- Workbook scripting support
-
Workbook scripting supports event links for before and after the relational data is built or saved, as well as methods for building and saving the relational data.
For an Essbase Excel view, additional capabilities include:
- Essbase data and relational data on the same sheet
-
The Essbase Excel view type also supports the ability to write back changes to the relational database.
- Cascading Essbase data and relational data on the same sheet
-
A cascaded view can also have non-cascade sheets that contain Essbase and/or relational data.
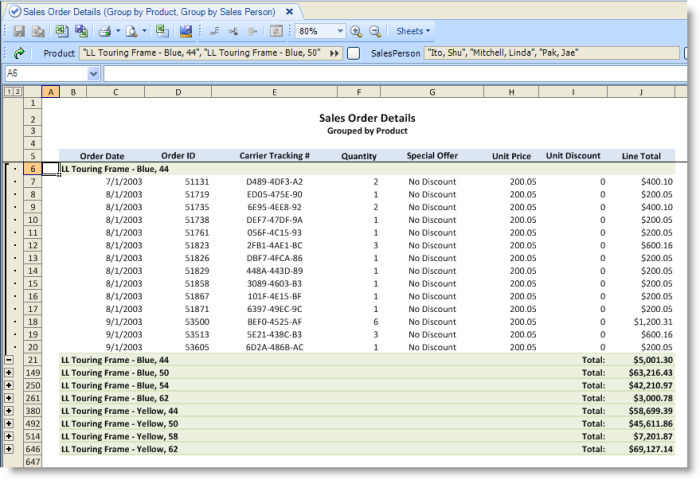
Below is a screenshot of a SQL Excel view that represents a sales order details report.
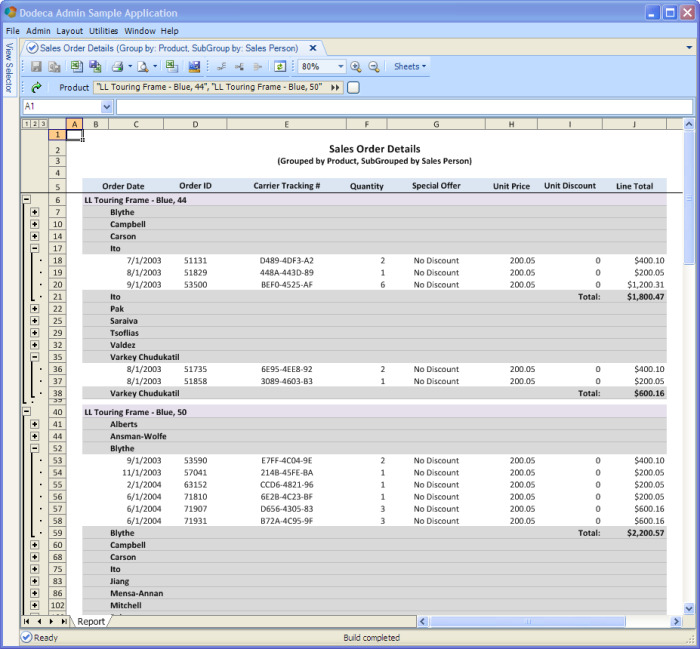
The Sales Order Details view groups the order details by product and, within each product, lists the orders for each sales person.
Sales Order Details
The Sales Order Details view demonstrates the following capabilities:
-
Multiple levels of row groupings: Each of the first level or outermost groups represents one of the selected products. Within each product group, the order details are sub-grouped based on the sales person responsible for the orders.
-
Excel formulas: The SUM function is used to total the order amounts for each sales person within a product group.
-
Excel outlining: The product groups and sales person groups can be expanded or collapsed using Excel outlining. Excel outlining can optionally be enabled for a given level of groupings and can be expanded or collapsed by default.
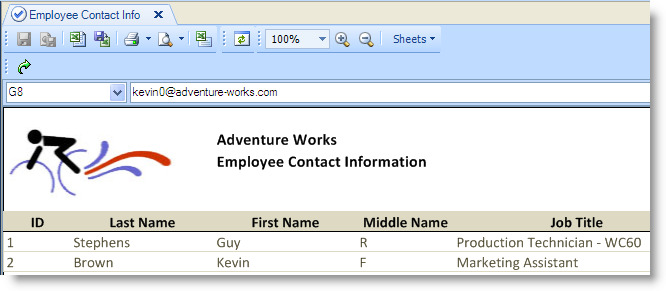
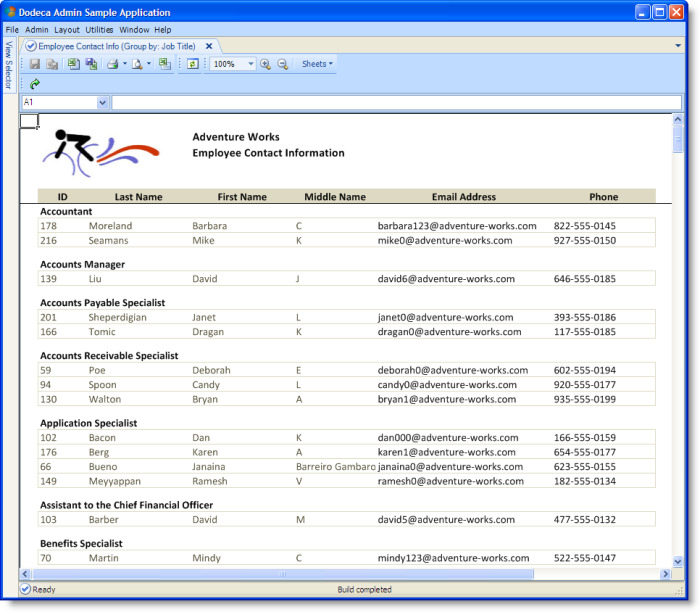
The Employee Contact Information view, as shown in the following figure, presents contact information, including the ID, name, job title, email address, and phone number for all the employees. This view is used in the following sections to introduce the relevant concepts and terminology and describe the metadata settings that are used to integrate relational data into either a SQL Excel or an Essbase Excel view.
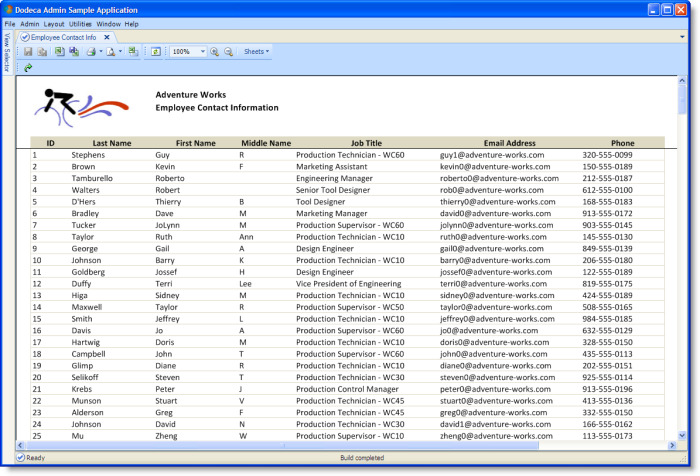
The Employee Contact Information view presents the ID, name, job title, email address, and phone number for each employee. This view uses data from the Adventure Works database, which is a sample database available for SQL Server.
Defining the Relational Data Used by a View
A SQLPassthroughDataSet defines one or more queries that generate the relational data presented in a view. Each query specifies the database connection and the SQL statement used to retrieve the database records. The query can return data from multiple database tables through the use of joins. However, the records returned by the statement are contained in a single DataTable on the client.
A SQLPassthroughDataSet that defines multiple queries generates a DataSet that contains multiple DataTables. All the queries defined by a SQLPassthroughDataSet are executed by a single roundtrip to the server, which is important to consider when optimizing the performance of a view.
| When designing a view that displays data that is generated by different queries, there are various options to consider when defining the data. The first option is to define a single SQLPassthroughDataSet that contains multiple queries. The second option is to define a different SQLPassthroughDataSet for each query. And, a third option is implied, which is to selectively define a SQLPassthroughDataSet for one or more of the queries. Deciding the best approach is a primarily a factor of how many records each query can potentially return. |
All the queries defined by a SQLPassthroughDataSet are executed by a single roundtrip to the server. Additionally, the request is performed on a background thread. Once the results are received by the client, the data is copied to the workbook, which is processed is on the main thread. When multiple SQLPassthroughDataSets are used, the request for the next data set is processed on a background thread and the copying of the data to the workbook for the previously requested data set is processed on the main thread. This concurrent processing can reduce the overall time it takes to build the view.
Defining a single SQLPassthroughDataSet that contains multiple queries is preferable when each query returns a relatively small number of records. Defining a different SQLPassthroughDataSet for a given query is preferable when the query can potentially return a large number of records.
The SQL Passthrough DataSet Metadata Editor, as shown in the following figure, provides the user interface for creating a SQLPassthroughDataSet.
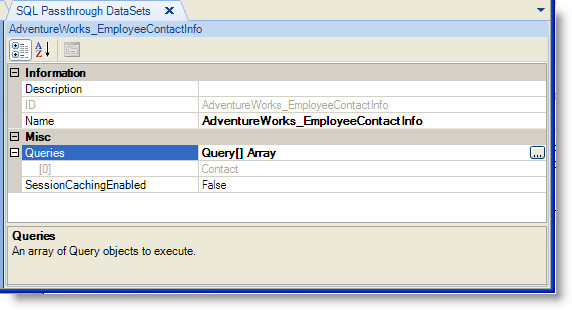
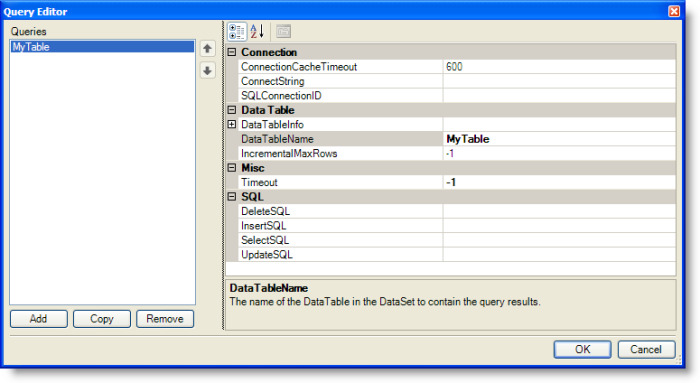
The AdventureWorks_EmployeeContactInfo data set defines a single query. From the SQL Passthrough DataSets Metadata Editor, clicking the Open Editor button at the right of the Queries label for the selected SQLPassthroughDataSet displays the Query Editor.
The query shown above specifies the SQLConnectionID, the DataTableName, and the SelectSQL. The SQLConnectionID is the ID of a JDBC connection for the Adventure Works database. (To define a SQL connection, use the SQL Connection Metadata Editor, which is accessible from the Admin menu.) The DataTableName, Contact, is the name of the DataTable on the client that contains the results of the query at runtime. The table name is also used when configuring the view to use the data. The SelectSQL defines the SELECT statement. Click the Open Editor button at the right of the SelectSQL value field to display the text editor. The SELECT statement for the Employee Contact Information is shown in the following figure.
The following guidelines apply when defining the SELECT statement:
-
The SELECT statement must use the native syntax supported by the database.
-
If a selected column is used as a parameter in the InsertSQL, UpdateSQL, or DeleteSQL, an alternate name or alias cannot be specified for the column. In other words, the column name returned by the statement must be the same as the column name in the source database table. Aliases are most commonly used when the selected value is an expression that does not have a name in the database, such as when string column values are concatenated. When a column is referred to in an expression, it is typically not a column that would be used as parameter in an Insert, Update, or Delete statement. And, since the name of the column displayed in the view can be specified in the view’s Excel template, the need to use an alias for a column name is less of a necessity.
-
The statement can be tokenized. A tokenized SELECT statement is used, for instance, when the statement contains a WHERE clause that defines the search criteria for rows based on selected items by including one or more selector tokens, such as “WHERE Sales.SalesOrderDetail.ProductID IN ([T.Product])” where [T.Product] is a comma-delimited list of product IDs.
Configuring a View To Use Relational Data
Now that the relational data is defined, the next step is to configure the view to use the data.
Both the SQL Excel and Essbase Excel view types support a DataSetRanges property.
From the Views Metadata Editor, as shown in the previous figure, click the Open Editor button at the right of the DataSetRanges (Collection) label to display the DataSet Range Editor, as shown in the following figure.
A SQLPassthroughDataSet can define one or more queries. At runtime, a separate DataTable contains the results of each query. To indicate where the records in a specific table are copied to on a worksheet, a SQLPassthroughDataSetRange associates each DataTable generated by a SQLPassthroughDataSet with a named range on a worksheet in the view’s Excel template.
You use the DataSet Range Editor, as shown in the previous figure, to define the SQLPassthroughDataSetRanges for a view. A SQLPassthroughDataSetRange contains several properties:
The Name property uniquely identifies the SQLPassthroughDataSetRange instance within the editor and is also used to report progress in the view’s status bar at runtime.
The SQLPassthroughDataSetID identifies the SQLPassthroughDataSet that generates the data. A DataTable contains the data for a single query. The mapping of each DataTable to a sheet range along with the settings that control the behavior, such as how the data is copied to the sheet and whether or not and how the rows are grouped, is defined by the DataTableRanges property.
The AutoBuildOnViewBuild setting controls whether the data set range is built when the view is built. By default, the value is True, which is the typically the appropriate behavior. Alternatively, a data set can be built by calling BuildDataSetRange method from a workbook script. When a data set range is built, the SQLPassthroughDataSet is executed, which means that all of the queries defined by the data set are executed within a single request to the server. The results of each query are then copied to the view as defined by the DataTableRange associated with the query’s data table.
The DataSetTokens property is optional and defines tokens that are included along with the default tokens for token replacement. The default tokens include the view tokens, application tokens and, if applicable, selector tokens as well as any tokens added by a workbook script.
The DataTableRanges property maps each DataTable generated by the SQLPassthroughDataSet to a worksheet range and configures the settings that control the presentation and behavior of the data.
From the DataSet Range Editor, as shown in the previous figure, click the Open Editor button at the right of the DataTableRanges (Collection) label to display the DataTable Range Editor.
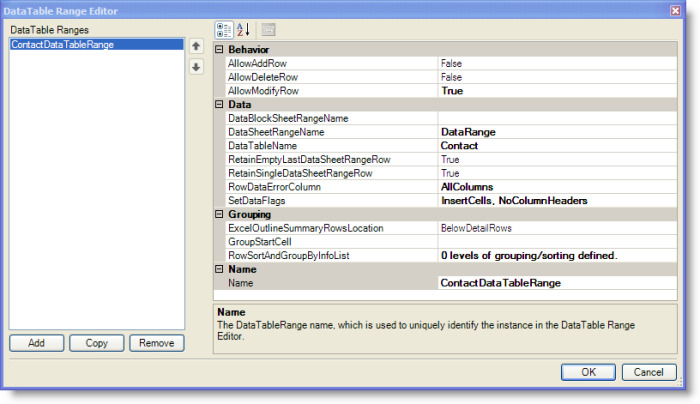
In addition to the Name, the other required settings for a data table range include the DataTableName and the DataSheetRangeName.
DataTable Range: Data Properties
The DataTableName is the name of the DataTable generated by a query that is defined by the SQLPassthroughDataSet. At runtime, the results of the query are copied to the range specified by the DataSheetRangeName setting, which specifies the name of a sheet-level range. This range is referred to as the data range.
Another important setting is the SetDataFlags, which controls how the data table rows are copied to the data range. The setting supports three options, which can be enabled and disabled independently:
-
With the InsertCells option enabled, cells are inserted into or deleted from the data range as necessary to accommodate the actual number of rows of data. The formatting defined for the data range is applied to all the rows inserted into the range. It also preserves column formulas that refer to a column in the last row of the data range, such as a SUM formula.
-
With the NoColumnHeaders option enabled, the column headers are not copied to the first row of the data range. This allows for the column headers to be excluded altogether, or to be specified in the Excel template. By specifying the column headers in the template, the headers presented in the view can be different than the actual column headers returned by the query. When designing the template, it may also make it easier to envision what the view will look like at runtime.
-
With the AllText option enabled, all values are stored and formatted as text, including numeric and boolean types, which are converted to text. With the option disabled, an attempt is made to parse the values to determine if numeric or boolean, and automatically use the best cell type and formatting based on the data type.
The DataBlockSheetRange is an optional setting, which specifies the name of a sheet-level range that contains the data range as well as additional columns, which can contain formulas that refer to cells on the same row within the data range. It can also contain additional rows.This range is referred to as the data block. The rows within the data block are automatically maintained when rows are added to, inserted into, and deleted from the data range.
The following should be considered when designing the view’s Excel template and defining the data range and, optionally, the data block:
The number of rows required in the range is determined by the InsertCells and NoColumnHeaders options:
-
When the InsertCells option is enabled, the data range must contain exactly two rows, unless the NoColumnHeaders option is disabled, in which case the data range must contain exactly three rows to accommodate the column headers.
When a query returns no rows, the RetainSingleDataSheetRangeRow setting controls whether a single data row is retained in the data range. If column formulas are defined that reference the last row of the range, RetainSingleDataSheetRangeRow should be set to True to preserve the formulas and prevent a #REF error.
When a query returns multiple rows, any formulas that reference the last row of the original data range are automatically adjusted to reference the last inserted row of data.
-
When InsertCells is disabled, the data range can contain a single row. If the NoColumnHeaders option is disabled, the column headers are copied to the range row. If NoColumnHeaders option is enabled, the first data row is copied to the range row.
The number of columns in the data range controls the number of columns copied from the data table to the sheet.
-
When the data range contains a single column, all the columns in the data table are copied to the sheet.
-
When the data range contains more than one column, the equivalent number of columns is copied to the sheet. The data table can contain more columns than the data range.
The size of the data range is automatically adjusted based on the number of columns and rows copied to the sheet.
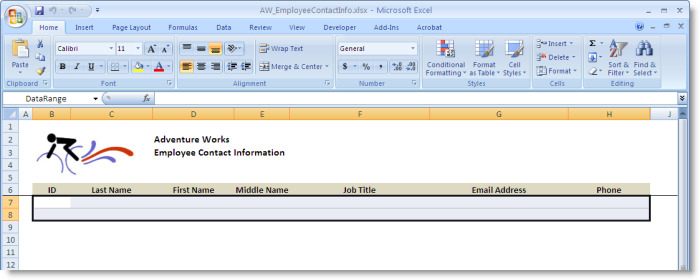
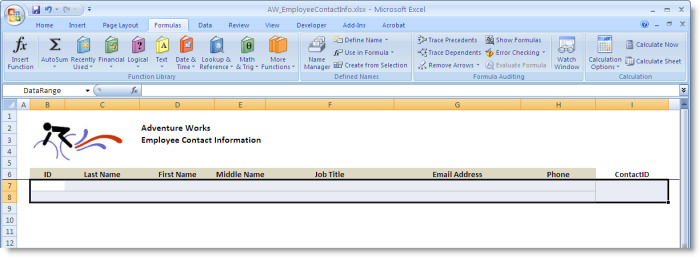
To illustrate these settings, let’s take a look at the Employee Contact Information view. For this view, we want to specify the column headers in the template. We also want to define the formatting used for all the data rows in the template. To this end, we have defined a sheet-level range, DataRange, in the view’s template, which is shown as the selected range in the following figure. The range contains exactly two rows and the cells are formatted with borders. The row above the range contains the column headers.
The previous figure shows the related settings for the DataTableRange named ContactDataTableRange. The DataTableName Contact is the same DataTableName specified for the query in the Query Editor. The DataSheetRangeName, DataRange, is the name of the data range defined in the template, as shown in the figure above. The InsertCells and NoColumnHeadersSetDataFlags options are enabled. With these settings, rows are inserted into the sheet range to preserve the formatting and the column headers returned by the query are not copied to the first row in the range.
With only the required settings specified, including the ExcelTemplateBinaryArtifact, the View ToolbarsConfigurationID, the WindowsViewUIObjectTypeID, and the DataSetRanges as discussed, the Employee Contact Information view definition is fully functional.
Enabling Relational Writeback
To review, a SQLPassthroughDataSet defines one or more queries. Each query defines the SELECT statement that retrieves data from the database. On the client, the results of the SQLPassthroughDataSet are stored in a DataSet, which contains the results of each query in a separate DataTable. A SQLPassthroughDataSetRange associates a DataSet with a view and defines a DataTableRange for each DataTable to control the presentation and behavior of the data.
In addition to retrieving data, changes to the data can be written back to the database. These changes can include adding, deleting, and modifying rows. Each of these operations can be enabled or disabled independently, and are configurable for each DataTable presented by a view.
| The saving of changes from the client is designed for optimal performance. Only the added, deleted, and modified records are sent in the request to the Dodeca service and only information about the newly added and modified rows is returned in the response to the client. |
Enabling relational write back for a given DataTable within a view consists of the following:
From the SQL Passthrough DataSets Metadata Editor, use the Query Editor to:
-
Define the appropriate SQL statements, which optionally include an INSERT, DELETE, and UPDATE statement.
-
Define the SELECT statement to return the table’s primary key column(s) values.
-
Specify which column or columns represent the table’s primary key.
From the Views Metadata Editor:
-
Configure the DataTableRange to allow users to perform the appropriate operations, which optionally include adding, deleting, and modifying rows.
-
Configure the view to use a toolbars configuration that includes the appropriate tools for adding and/or deleting rows, and saving changes to the database.
Define the view’s Excel template to include the primary key column or columns within the DataTable’s sheet range, and use cell locking and sheet protection to prevent users from editing cells that contain non-editable data.
As shown in the following figure, a Query can define an INSERT, DELETE, and UPDATE a statement.
The following guidelines apply when defining an INSERT, DELETE, or UPDATE statement:
-
The statement must use the native syntax supported by the database.
-
The statement should include a parameter for each value that refers to a column in the data table. The parameter name must be the same as the corresponding column name. The column name must be the same as the column name returned by the SELECT statement. Note that the columns in the SELECT statement, when used in conjunction with an INSERT, DELETE, or UPDATE statement must use the actual database column names.
Here are some examples:
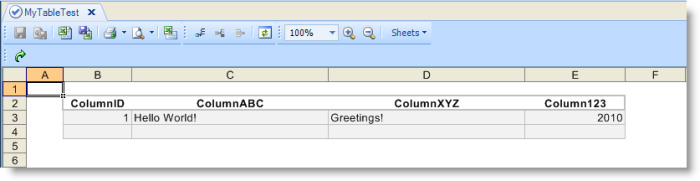
DELETE FROM MyTable WHERE ColumnID = @ColumnID
INSERT INTO MyTable (ColumnABC, ColumnXYZ, Column123) VALUES (@ColumnABC, @ColumnXYZ, @Column123) WHERE ColumnID = @ColumnID
UPDATE MyTable SET ColumnABC = @ ColumnABC, ColumnXYZ = @ ColumnXYZ, Column123 = @Column123 WHERE ColumnID = @ColumnID
-
The statement can be tokenized.
As shown in a previous figure, a DataTableRange has three properties that control whether or not a user can add, delete, or modify rows within the range: AllowAddRow, AllowDeleteRow, and AllowModifyRow By default, a user is not allowed to perform these operations.
The RetainEmptyLastDataSheetRangeRow property determines whether an empty row is automatically added and maintained as the last row in the range, which allows a user to enter values without having to explicitly add a row. To illustrate, the DataTableRange for the view shown in the following figure is configured to allow a user to add rows. As shown, the range contains two rows. The first row represents the only data row returned by the query. The last row is automatically added as the last row of the range. When any cell in the last row is edited, a new empty row is automatically added below the edited row.
The AllowAddRow, AllowDeleteRow, and AllowModifyRow properties work in conjunction with the Add Row, Insert Row, Delete Row, and Save tools. These tools are delivered as standard tools and are identified by the following keys: AddDataTableRangeRows, InsertDataTableRangeRows, DeleteDataTableRangeRows, and SaveDataSetRanges. You can add these tools to any toolbar or context menu.
The AllowAddRow property controls whether a user is allowed to add or insert rows using the Add Row or Insert Row tools, respectively.
-
The Add Row tool is enabled only when either of the following conditions is met:
1) Multiple ranges are represented on the sheet and the active cell is within a range that allows rows to be added, or
2) Only one range is represented on the active sheet and the range allows rows to be added. The number of rows added to the range is equivalent to the number of selected rows.
-
The Insert Row tool is enabled when the active cell is within a range that allows rows to be added. The row in inserted above the active row. The number of rows inserted is equivalent to the number of selected rows.
The AllowDeleteRow property controls whether a user is allowed to delete rows from the range.
-
The Delete Row tool is enabled when the active cell is within a range that allows rows to be deleted.
The AllowModifyRow property controls whether a user can save modified rows. When AllowModifyRow is False, the user is not prevented from editing cell values. To prevent the user from editing cells that contain non-editable data, you can lock the cells and protect the sheet.
The Save tool is enabled only when the user is allowed to add, delete, or modify rows for any range.
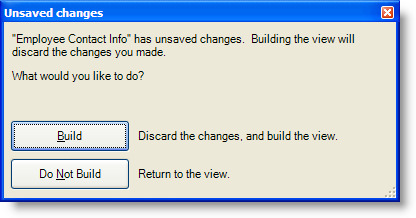
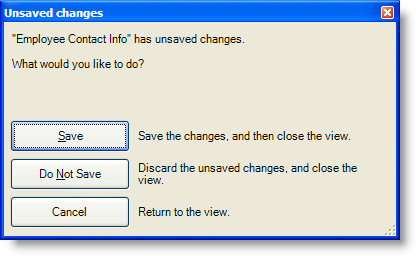
When a view is built or closed, the Save tool determines whether the view contains unsaved changes. If so, the tool prompts the user.
When the user attempts to build the view and unsaved changes are detected, the Save tool prompts the user as shown in the following figure.
Similarly, the Save tool prompts the user when the view is closed and unsaved changes are detected, as shown in the next figure.
Let’s take a look now at how to change the Employee Contact Information view to allow users to write back changes to the database. We’ll configure the view to allow users to modify only the email address and phone number for an employee, but disallow users from adding or deleting rows.
The following summarizes the necessary changes to Employee Contact Information view and to the related SQL pass-through dataset metadata:
-
Add an UPDATE statement to the Query.
-
Specify the Contact table’s primary key column for the Query.
-
Modify the SELECT statement to return the primary key column.
-
Modify the view’s DataTableRange associated with the Contact table to allow users to save modifications to the database.
-
Configure the view to use a toolbars configuration that includes the Save tool.
-
Modify the view’s Excel template to expand the sheet range to include a hidden column that contains the ContactID. Lock the cells that contain the Employee ID, name, and job title values, and then protect the sheet.
From the SQL Passthrough DataSets Metadata Editor, we use the Query Editor to make the following changes to the AdventureWorks_EmployeeContactInfo dataset:
-
Add an UPDATE statement to the Query.
The UpdateSQL property defines the UPDATE statement.
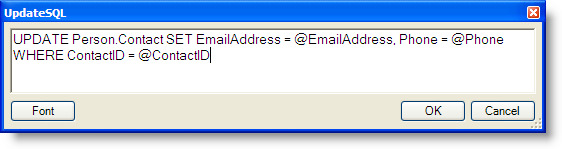
As shown in the figure above, the UPDATE statement contains a parameter for the EmailAddress and Phone columns as well as the primary key column ContactID in the WHERE clause. As previously noted, the name of each parameter must be the same as the corresponding column name and the column names must be the same as returned by the SELECT statement.
-
Specify the Contact table’s primary key column for the Query.
When the InsertSQL, DeleteSQL, or UpdateSQL is specified for a query, the DataTableInfo.PrimaryKey identifies the primary key column or columns.
As shown in the figure above, the Contact table’s primary key column is ContactID.
-
Modify the SELECT statement to return the primary key column.
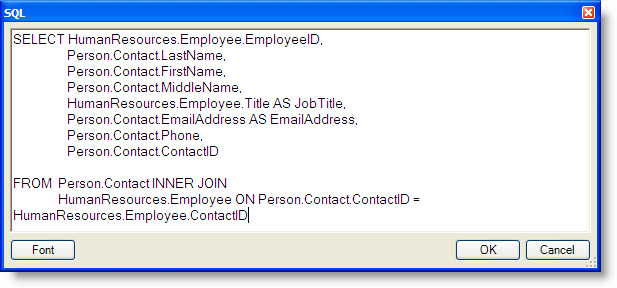
Since the UPDATE statement uses the Person.Contact table’s primary key value to identify which row to update, we also modify the SELECT statement to return the ContactID column, as shown in the next figure.
From the Views Metadata Editor, we use the DataTable Range Editor to make the following changes:
-
Modify the view’s DataTableRange associated with the Contact table to allow users to save modifications to the database.
For this example, we only want to allow users to save modifications to the email addresses and phone numbers, the AllowModifyRow property is set to True, but the AllowAddRow and AllowDeleteRow properties are set to False.
-
Configure the view to use a toolbars configuration that includes the Save tool as shown in the following figure.
-
Modify the view’s Excel template.
We expand the DataRange to include an additional column for the primary key ContactID, as shown in the next figure.
| The primary key value must be stored in the data range when used for adding, deleting, or updating a row in the database, but the column can be hidden in the sheet. |
To prevent a user from editing the employee ID, name, or job title, the cells for these columns within the range are locked and the sheet is protected. The font color is also changed to provide a visual cue that these values cannot be edited.
With these changes in place, users can now use the Employee Contact Information view to modify the email address and phone number for employees in the Person.Contact database table.
Reporting Row Data Errors
When a user saves changes, an Excel comment displays any row data errors that were encountered by the client or returned by the database for each row that contains an error.
Before posting the changes, the client must first determine what values, if any, have changed by comparing the values on the sheet with the values originally returned by the query. To perform the comparison, the values are converted to the appropriate data type. If any value cannot be converted, such as converting the string “abc” to a double, then the client does not update any values, and displays an error for each row that contains an invalid value, as shown in the following figure.
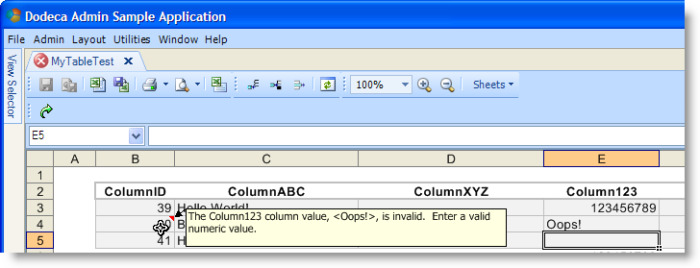
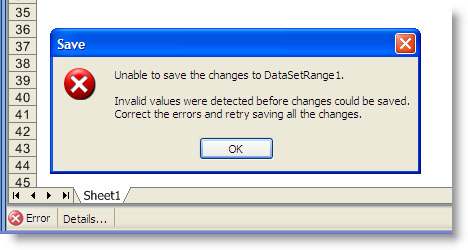
The Details button in the status bar displays a message box, as shown in the next figure, that indicates invalid values were detected before any changes could be saved, and instructs the user to correct the errors and retry saving all the changes.
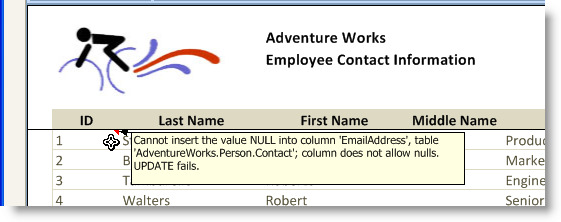
If the client is able to successfully convert all the values and detects any changes, the changes are sent to the server and the server posts the changes to the database. Any errors that are returned by the database are relayed back to the client and displayed as an Excel comment for each row that generated an error, as shown in the next figure. All valid changes are saved.
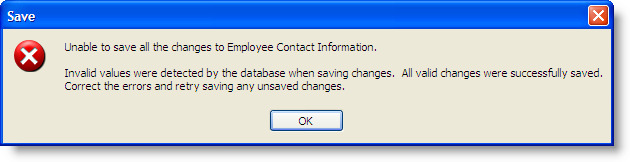
The Details button in the status bar displays a message box, as shown in the next figure that indicates invalid values were detected by the database, and that all valid changes were successfully saved. It instructs the user to correct the errors and retry saving any unsaved changes.
The RowDataErrorColumn setting controls which cell(s) contains the Excel comment. The setting can be modified in the DataTable Range Editor.The setting can be modified in the DataTable Range Editor.
The RowDataErrorColumn supports the following options:
-
None does not display an Excel comment.
-
FirstColumn, which is the default, displays the Excel comment in the first visible column in the data range.
-
ColumnToLeftOfDataSheetRange displays the Excel comment in the column to the left of the first column in the data range.
-
AllColumns displays the Excel comment in all of the visible columns in the data range.
For example, the Employee Contact Information view’s Contact data table range is configured with the RowDataErrorColumn set to AllColumns. The The EmailAddress database column does not allow nulls. When null is sent to the database as the EmailAddress value for a row, the database returns an error and an Excel comment is added to all the cells within the data range of the row that generated an error as shown in the next figure.
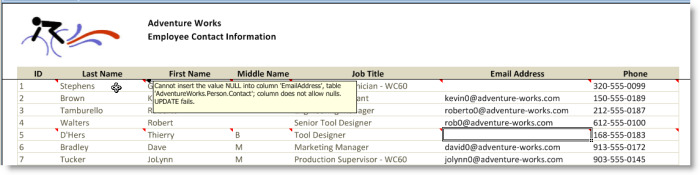
With the RowDataErrorColumn set to AllColumns, each cell, within the data range of a row that generated an error, displays the error as an Excel comment.
Returning Default Column Values for Newly Added Rows
When changes are saved, the view automatically refreshes any newly added rows to reflect the primary key values, if possible. To present default values other than the primary key, the query’s InsertSQL can include a SELECT statement that retrieves columns that have a default value defined. For example, the view shown in the figure below presents data that contains a CreatedDateTime column, which is configured in the database to default to the current date and time.
| If the primary key is a generated field, an attempt is made to set the parameter automatically based on the values returned from the JDBC driver. If the JDBC driver does not return the value, the primary key value will be null. |
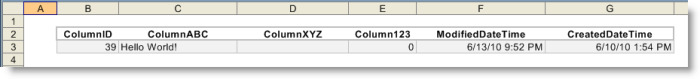
By defining the query’s InsertSQL to append a SELECT statement to the INSERT statement, the default CreatedDateTime value is returned and presented by the view when changes are saved. The SELECT statement can either return the specific columns or use a wildcard to return all the columns:
INSERT INTO MyTable (ColumnABC, ColumnXYZ, Column123) VALUES (@ColumnABC, @ColumnXYZ, @Column123);SELECT CreatedDateTime FROM MyTable
INSERT INTO MyTable (ColumnABC, ColumnXYZ, Column123) VALUES (@ColumnABC, @ColumnXYZ, @Column123);SELECT * FROM MyTable
Using Stored Procedures
The InsertSQL, UpdateSQL, and DeleteSQL statements can call a stored procedure by using the SQL escape sequence syntax as defined by the JDBC API. The escape sequence is typically supported by the JDBC drivers. The escape sequence syntax for calling a stored procedure is as follows:
\{call procedure_name [(parameter],[, [parameter]]…)]}
For example, the following UpdateSQL statement calls a stored procedure, named spUpdateMyTable, that is defined in a SQL Server database. A SELECT statement is appended to the stored procedure call in order to return the ModifiedDate column value to the client.
call spUpdateMyTable(@ColumnABC, @ColumnXYZ, @Column123, @ColumnID)};
SELECT ModifiedDateTime from MyTable WHERE ColumnID = @ColumnID
| When calling a stored procedure, the parameters must be specified in the same order as defined in the stored procedure. __ |
The stored procedure is defined as follows:
SET ANSI_NULLS ON
GO
SET QUOTED_IDENTIFIER ON
GO
CREATE PROCEDURE spUpdateMyTable
   @ColumnABC nvarchar(50),
   @ColumnXYZ nchar(10),
   @Column123 int,
   @ColumnID int
AS
BEGIN
   UPDATE MyTable SET ColumnABC = @ColumnABC, ColumnXYZ =
   @ColumnXYZ, ModifiedDateTime = GETDATE(), Column123 = @Column123 WHERE ColumnID = @ColumnID
END
GO
Grouping and Sorting Rows
Grouping and sorting of the data is supported for both the SQL Excel and Essbase Excel view types. The rows retrieved by a query can be automatically organized and presented with one or more levels of grouping. Each level is based either on the values of one or more columns or on conditional expressions that are used to filter the rows. The data within each group of rows can be sorted in ascending or descending order based on one or more columns.
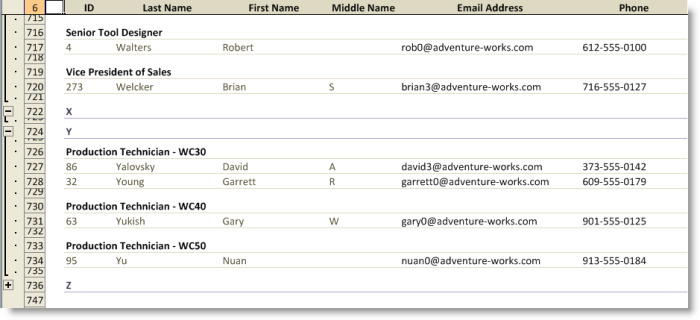
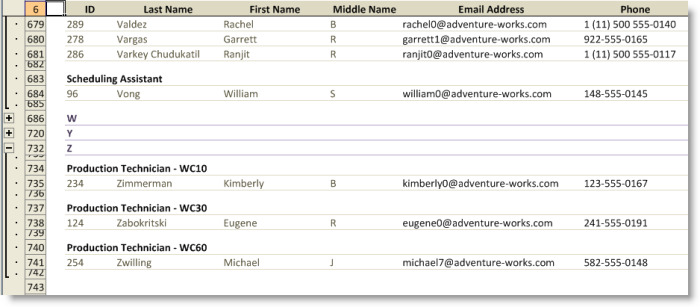
The Employee Contact Information view shown in the following figure is configured to group the employee records by job title. Within each group, the records are sorted in ascending order by the combination of the last and first names.
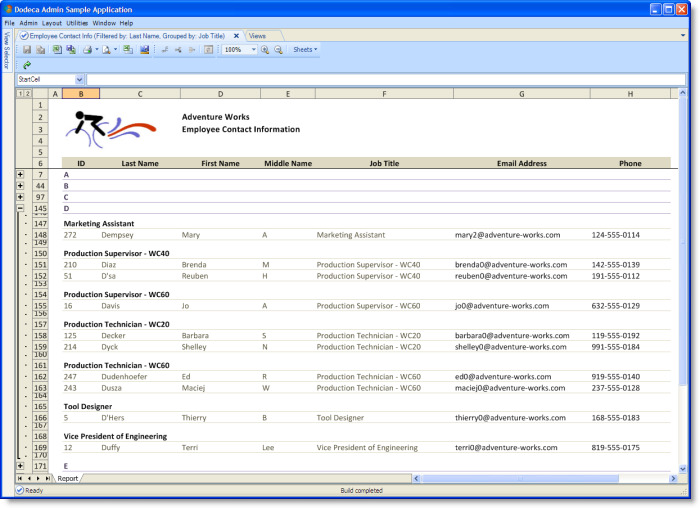
The view in the following figure shows an additional level of grouping of the employee records. The rows are grouped based on the first letter of the last name and sub-grouped based on an employee’s job title.
Configuring a view to group rows consists of the following:
-
Use the view’s DataTable Range Editor to define each level of grouping for the DataTableRange that represents the rows to be grouped.
-
Design the view’s Excel template to contain the template ranges for each level of grouping. The template range is copied for each occurrence of the grouping.
Let’s start with the definition of grouping and sorting within a view’s metadata.
As discussed previously, a DataTable range associates the results of a query, which are contained by a DataTable , with a range on a worksheet. The settings for a specific DataTable range are modified using the DataTable Range Editor.
The settings that control whether and how the rows are grouped are listed under the Grouping category, and include the following: ExcelOutlineSummaryRowsLocation, GroupStartCell, and RowSortAndGroupInfoList.
The ExcelOutlineSummaryRowsLocation controls the location of the group summary rows relative to the detail rows. The summary row for each group can appear above or below the detail rows. The setting supports two options: AboveDetailRows and BelowDetailRows. This setting applies to all levels of Excel groups, which is the behavior supported by Excel.
Each level of grouping defined by the RowSortAndGroupByInfoList can optionally enable or disable Excel outlining. In this example, Excel outlining is enabled for the outer Product Category groups and is presented with the summary rows located above the detail rows. Notice that the +/- (expand/collapse) icon is displayed to the left of the summary rows.
In the view shown in the following figure, the summary rows are presented below the detail rows.
The GroupStartCell is the defined range name or range reference that marks where the first occurrence of the outermost grouping level is copied to.
| The use of the GroupStartCell setting is illustrated in the section below that describes how to design the view’s Excel template for grouping. |
The RowSortAndGroupInfoList is a collection of RowSortAndGroupInfo instances where each instance represents and defines a level of grouping.
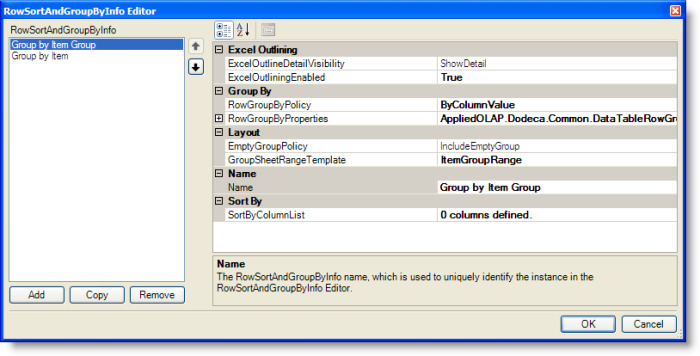
From the DataTable Ranges editor, clicking the Open Editor button at the right of the RowSortAndGroupInfoList (Collection) label displays the RowSortAndGroupInfo Editor, which is shown in the following figure.
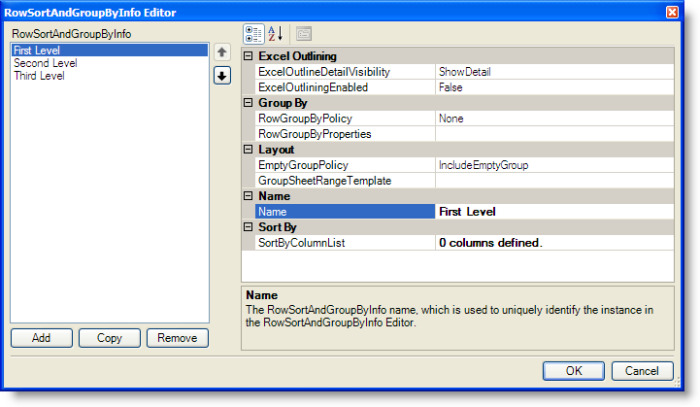
For explanation purposes, three levels of groupings are defined and named First Level, Second Level, and Third Level. At runtime, each occurrence of the First Level grouping can contain multiple occurrences of the Second Level. And, each occurrence of the Second Level grouping can contain multiple occurrences of the Third Level. The lowest level, in this case the Third Level, can be sorted based on one or more columns.
RowSortAndGroupByInfo: Group By Settings
The RowGroupByPolicy defines the criteria used to group the rows. The option also determines the RowGroupByProperties settings. The options include the following:
None – This option is used when the rows are to be sorted, but not grouped. With this option, the SortByColumnList must be defined.
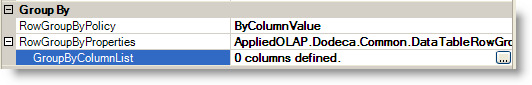
ByColumnValue – Each group contains rows that have the same value for one or more specified columns. With this option, the RowGroupByProperties displays the GroupByColumnList property.
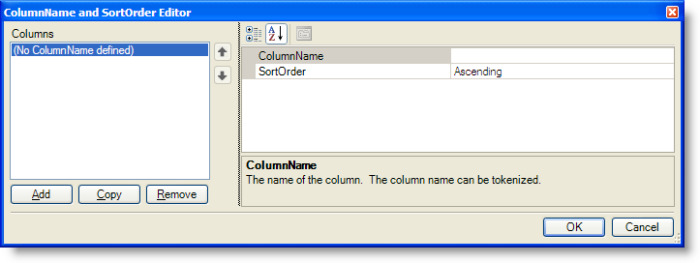
Clicking the Open Editor button to the right of the label displays the ColumnName and SortOrder Editor, shown in the figure below, which is used to specify the name of the column or columns by which the rows will be grouped and the sort order applied to the values before grouping.
At runtime, when a group of rows is created based on column values, a token is automatically created for each column in the DataTable. The tokens are used for token replacement within the template range that is copied for the group of rows. This allows the group template range, for example, to contain a header. The format of each token name is [T.<ColumnName>.Value] where <ColumnName> is the name of the column represented by the token. The token is assigned the value of the corresponding column from the first row of the group.
An example of using the column value tokens is included in the following discussion about how to design the Excel template for grouping.
ByFilter – Each group contains the rows that meet the specified filter criteria, which is defined by an expression. With this option, the RowGroupByProperties displays the FilterList property.
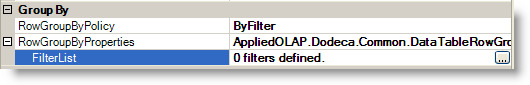
Clicking the Open Editor button to the right of the label displays the Filter List Editor, shown in the following figure, which is used to define the expressions used to filter the rows.
At runtime, the rows in the DataTable, or the rows in the parent group, are filtered using the expressions defined in the FilterList. For each filter, the resulting group of rows is either sub-grouped, based on the next level of grouping, or copied to the sheet if no further sub-grouping is defined.
The Expression defines the conditions used to filter the rows. An expression can be tokenized.
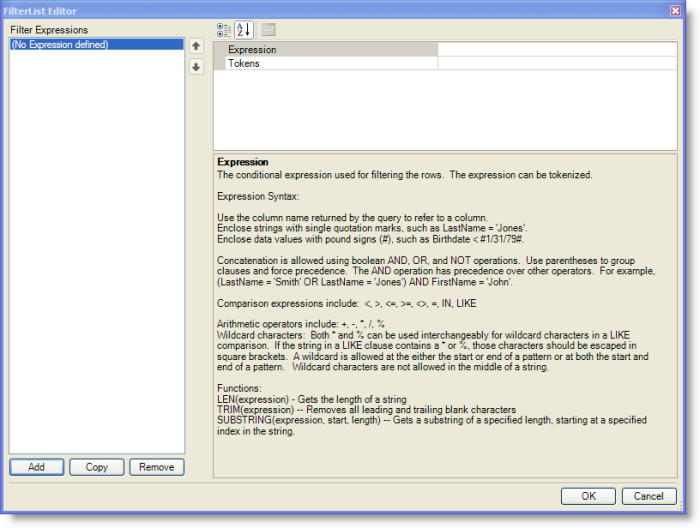
The following description of the Expression syntax is also available in the editor, as shown in the screenshot above:
-
Use the column name returned by the query to refer to a column.
-
Enclose strings with single quotation marks, such as LastName = 'Jones'.
-
Enclose date values with pound signs such as Birthdate < #1/31/79#.
-
Concatenation is allowed using boolean AND, OR, and NOT operations. Use parentheses to group clauses and force precedence. The AND operation has precedence over other operators. For example, (LastName = 'Smith' OR LastName = 'Jones') AND FirstName = 'John'.
-
Comparison expressions include: <, >, ⇐, >=, <>, =, IN, LIKE
-
Arithmetic operators include: +, -, *, /, %
-
Wildcard characters: Both * and % can be used interchangeably for wildcard characters in a LIKE comparison. If the string in a LIKE clause contains a * or %, those characters should be escaped in square brackets.A wildcard is allowed at the either the start or end of a pattern or at both the start and end of a pattern. Wildcard characters are not allowed in the middle of a string.
-
Functions include:
LEN(expression) — Gets the length of a string.
TRIM(expression) — Removes all leading and trailing blank characters.
SUBSTRING(expression, start, length) — Gets a substring of a specified length, starting at a specified index in the string.
The filter’s Tokens setting contains token definitions that are used to replace tokens within the GroupSheetRangeTemplate range that is copied for this group of filtered rows. For example, if the expression filters the rows based on the value of the Age column, such as “Age >= 21 AND Age ⇐ 50” and the range contains the token [T.AgeRangeCaption], then the Tokens could be used to define the token [T.AgeFilterCaption] with a value that identifies the rows in the group, such as “Age Classification: 21 to 50”.
RowSortAndGroupByInfo: Excel Outlining Settings
The RowSortAndGroupByInfo defines two settings that control Excel outlining: ExcelOutliningEnabled, which enables or disables outlining for the groups at this level, and ExcelOutlineDetailVisibility, which controls whether the detail rows are shown or hidden by default. ShowDetail is automatically expands each group to show the detail rows; whereas, HideDetail automatically collapses the groups to hide the detail rows.
| No limit is imposed on the number of levels of grouping that can be defined for a DataTableRange; however, Excel outlining can only be enabled for up to 8 of the grouping levels, since Excel does not support more than 8 levels. |
RowSortAndGroupByInfo: Layout Settings
The GroupSheetRangeTemplate is the name of the defined range used as a template range that is copied at runtime for each group of rows created at this level. When multiple levels of grouping are defined, the range for each parent grouping contains the range for the child grouping. The range specified as the DataTableRange’s SheetRange is the contained by the lowest level grouping’s range.
The EmptyGroupPolicy setting controls whether the GroupSheetRangeTemplate is copied to the sheet for an occurrence of a group that contains no rows.
When the RowGroupByPolicy is ByColumnValue, a group will contain no rows when either of the following conditions is met: 1) the query returns no rows, or 2) the RowGroupByPolicy of a parent group is ByFilter and no rows meet the filter criteria.
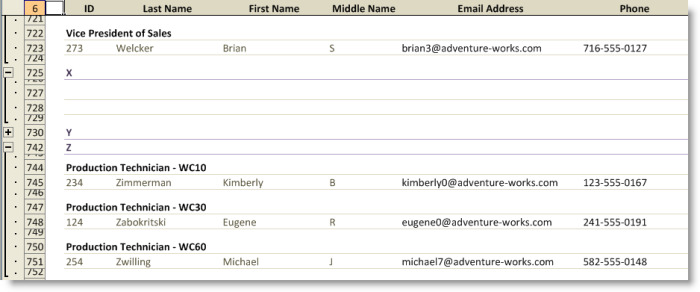
We’ll illustrate the EmptyGroupPolicy using the Employee Contact Information view that groups rows based on the first letter of the last name and subgroups the rows based on the job title. The first screenshot shows the effect when the EmptyGroupPolicy of both levels of groupings is defined with the EmptyGroupPolicy set to IncludeEmptyGroups. The range template for the group of rows that represent employees whose last name begins with the letter “X” is copied to the sheet, and the range that represents a subgroup based on job title is also copied.
For this view, it may be desirable to include an empty group for the letter “X”, so as not to skip the letter altogether, but it seems unnecessary to include an empty group for the job title as shown below.
By setting the EmptyGroupPolicy to ExcludeEmptyGroup for the RowSortAndGroupByInfo that represents the job title group, the effect is the following:
To further illustrate the capability, we’ll also set the EmptyGroupPolicy to ExcludeEmptyGroup for the RowSortAndGroupByInfo that represents the top level groups.
Next, we’ll take a look at how to design a view’s Excel template when the view is configured to group rows.
As mentioned, the GroupSheetRangeTemplate specifies the name of the sheet range in the Excel template that is copied for each group of rows that is created based on the RowSortAndGroupByInfo’s definition.
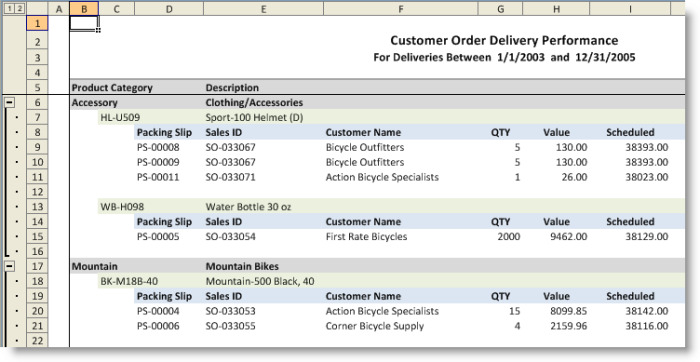
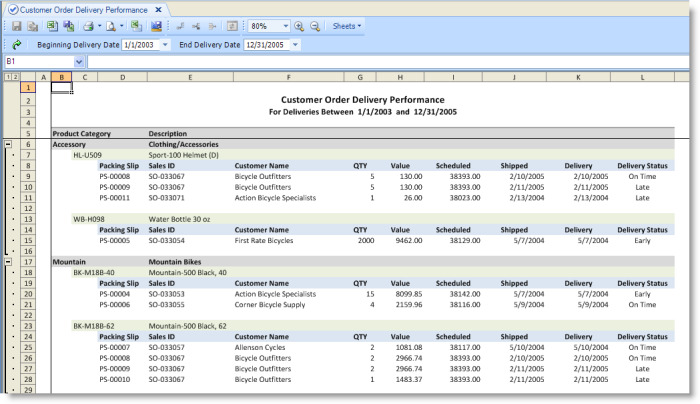
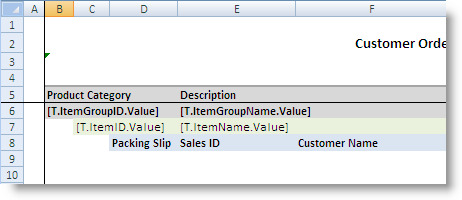
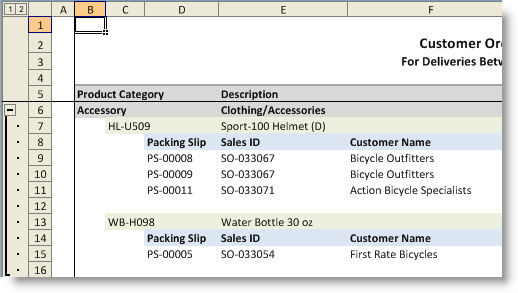
The Customer Order Delivery Performance view, as shown in the following figure, groups the rows based on the product category and sub-groups the rows within each category based on the related product items.
For reference, this is the RowSortAndGroupByInfo Editor for the Customer Order Delivery Performance view’s first level of grouping, which represents the product category groups.
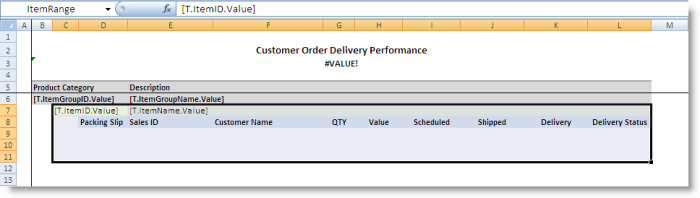
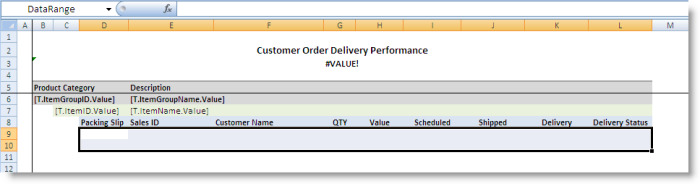
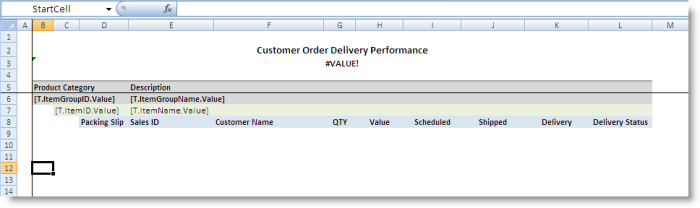
The Customer Order Delivery Performance view’s template defines four ranges: ItemGroupRange, ItemRange, DataRange, and StartCell.
The ItemGroupRange is specified as the GroupSheetRangeTemplate for the product category groups, as shown in the screenshot above. This range is copied for each product category.
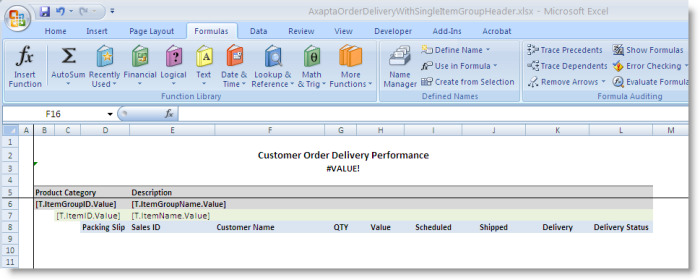
The ItemGroupRange contains the ItemRange, which is the range template for the product item groups. This range is copied for each product item within a given product category.
The ItemRange contains the DataRange, which is the range specified as the DataTableRange’s DataSheetRangeName. This is the range that contains the data within each product item group.
The last range is the StartCell, which is specified as the DataTableRange’s GroupStartCell. This range marks where the first product category group is copied.
The query returns the columns that contain the values presented for each row, including the packing slip ID, sales ID, customer name, quantity, value, scheduled date, delivery date, and delivery status. The query also returns the columns that contain the product category ID and description as well as the product item ID and description, which have the names ItemGroupID, ItemGroupName, ItemID, and ItemName, respectively.
The first row of the ItemGroupRange contains the tokens [T.ItemGroupID.Value] and [T.ItemGroupName.Value]. The first row of the ItemRange the tokens [T.ItemID.Value] and [T.ItemName.Value].
At runtime, when the ItemGroupRange is copied for the first product category group, Accessory, a token is created for each column returned by the query. The format of each token is [T.<ColumnName>.Value] where <ColumnName> is the name of the column represented by the token. The value of each token is the value of the corresponding column in the first row of the group. For the first product category group, the [T.ItemGroupID.Value] token value is “Accessory” and the [T.ItemGroupName.Value] token value is “Clothing/Accessories”. The tokens are replaced in the copied range.
The same processing occurs for each product item sub-group. So, for example, when the ItemRange is copied to the sheet for the first Accessory product item, the [T.ItemID.Value] token value is “HL-U509” and the [T.ItemName.Value] token value is “Sport-100 Helmet (D)”. For the next sub-group, the values are “WB-H098” and “Water Bottle 30 oz.”, respectively.
The column value tokens are typically used to uniquely label each group of rows.
This approach is only applicable when the RowGroupByPolicy is set to ByColumnValue.
After all the groups are added to the sheet, the group sheet range templates are deleted from the sheet.
Toolbar Configuration
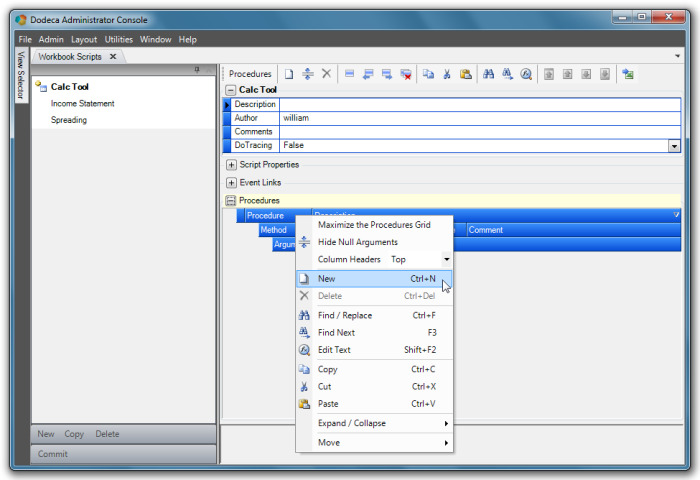
Dodeca provides the Administrator with the ability to customize and configure toolbars to fit the specific needs of different user groups. Administrators can edit existing toolbars by adding or removing tools or by copying and renaming with added tools. For this tutorial, a simple Workbook Script will be created and then associated with a tool. Adding this tool to an existing toolbar and renaming it will give the user the ability to initiate the Workbook Script by clicking on the tool.
Creating a workbook script
From the menu select menu:Admin[Workbook Scripts].
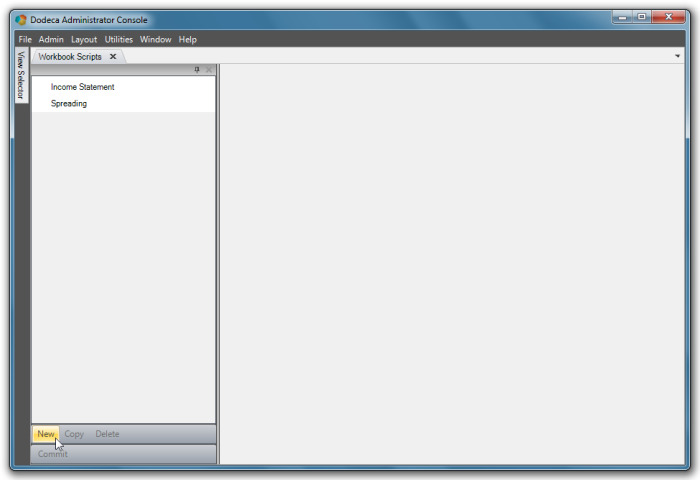
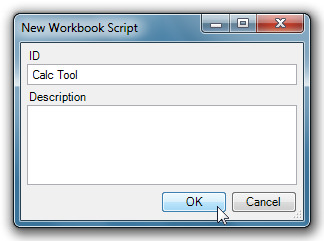
Click New and the New Workbook Script dialog displays.
Give the new workbook script the ID Calc Tool and press OK to continue.
The Calc Tool Workbook Script automatically opens for editing.
Right click on the Procedures column to display a menu, click on New in the menu to create a new procedure.
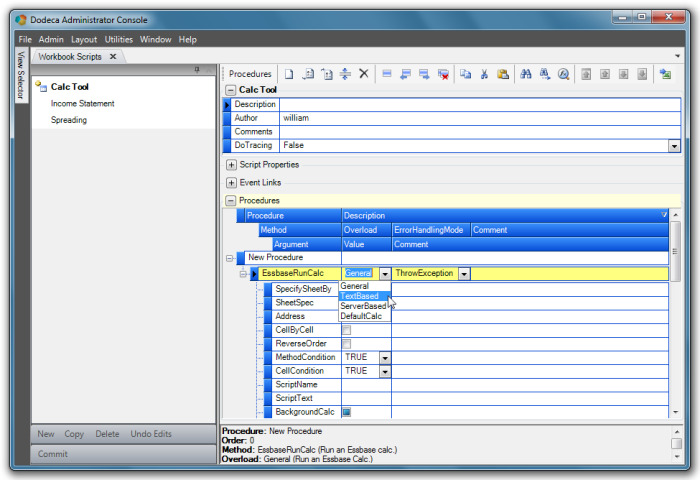
The new procedure will opens the Method selection menu. Select EssbaseRunCalc for the method.
In the Overload column (immediately to the right of the Method), select Text Based from the menu.
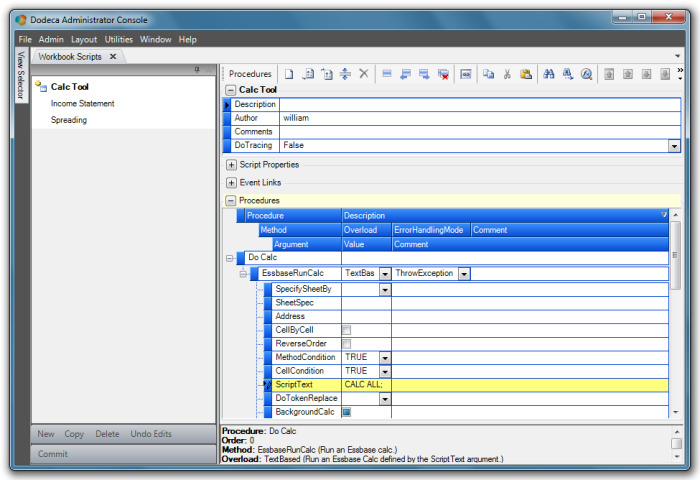
Select the ScriptText row and type in 'CALC ALL;' as the Argument Value.
Change the Procedure name by highlighting New Procedure and typing 'Do Calc'.
To add a message box to the procedure, highlight and right click on the EssbaseRunCalc method row. Click Add a new Method below the selected row option from the dialog menu.
Select ShowMessageBox for the method. Scroll down to the Message Argument, highlight it, and type in 'The Calc is Complete' for the value.
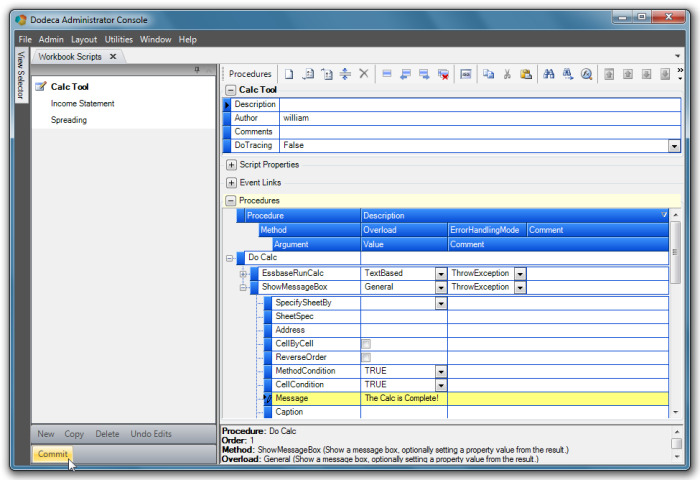
Click Commit to save the changes.
You can use this Essbase run calculation Workbook Script in any view, but for purposes of this tutorial, it will be the function of the new tool configured into a newly created toolbar.
Copying and Re-naming an Existing Toolbar
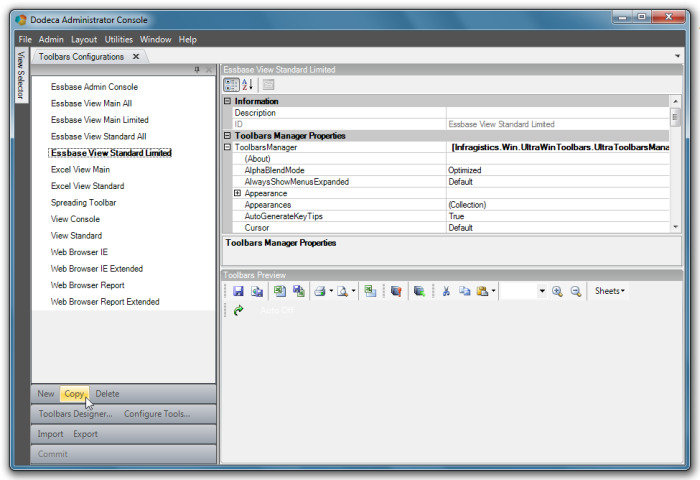
From the menu, select menu:Admin[Toolbar Configurations]. Select Essbase View Standard Limited and then click Copy.
The Copy Toolbars Configuration dialog displays.
Give the new toolbar the ID Essbase View Standard Limited with calc and click OK.
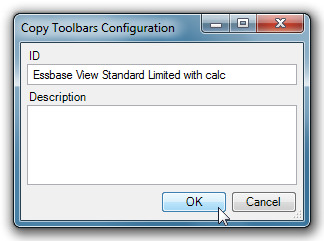
The original Essbase View Standard Limited Toolbar Configuration could have been edited to include a new tool, but in that scenario, every other view associated with that toolbar configuration would be changed as well. Copying and re-naming the configuration allows an Administrator to create custom toolbar configurations without losing the original version.
Toolbars Designer
The new configuration is now in the Toolbars Configuration Metadata Editor list and can be selected.
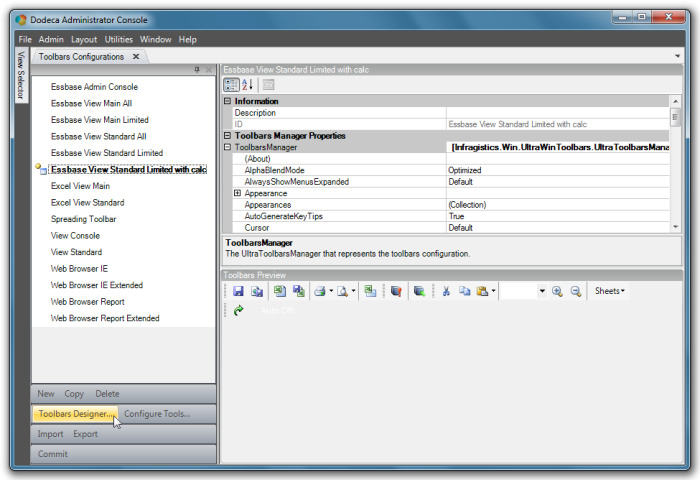
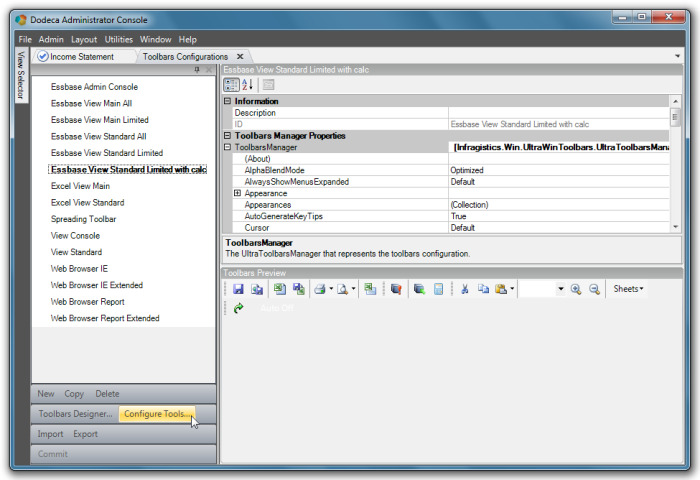
Click Toolbars Designer. A Toolbars Designer opens specific to the Essbase View Standard Limited with calc configuration.
Select the Tools tab and click New.
A New Tool dialog displays. Select Button for the Tool Type, Calc for the Caption, Calc for the Key, and Essbase for the Category.
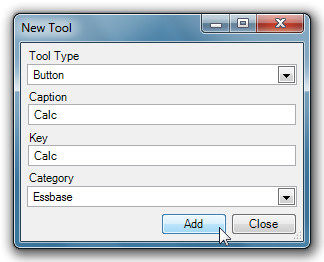
Click Add and then Close.
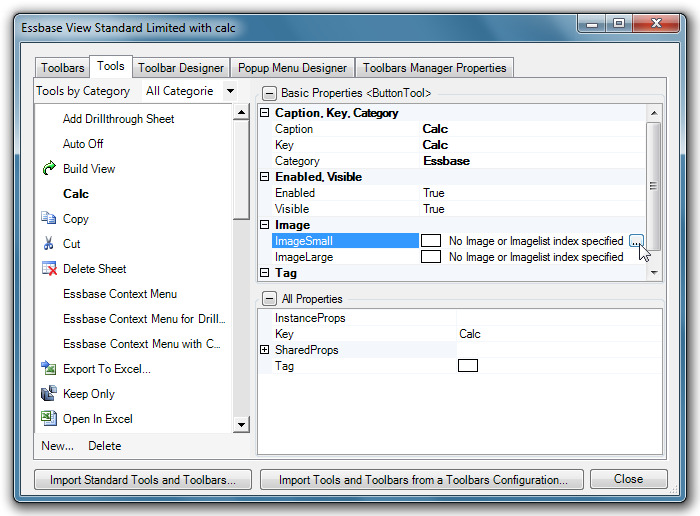
The Calc tool now appears in the list. Select the Calc tool and then select the ImageSmall property. Click on the ellipses to the far right to open the Appearance Image Editor dialog.
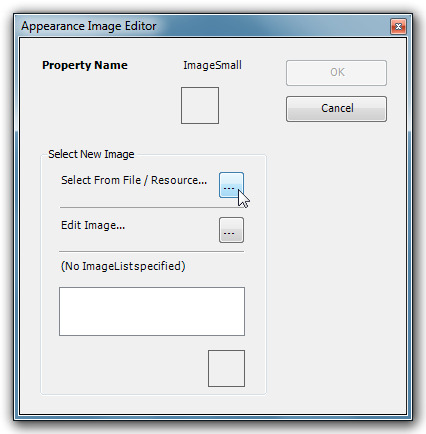
To add an image, click on Select From File/Resource ellipses and select an image from your files to associate with the tool. For this example we will use a small calculator icon for the image.
Move to the Toolbar Designer tab. Select the Toolbar dropdown menu and select Essbase.
The Essbase tools already associated with the configuration display in the list on the left.
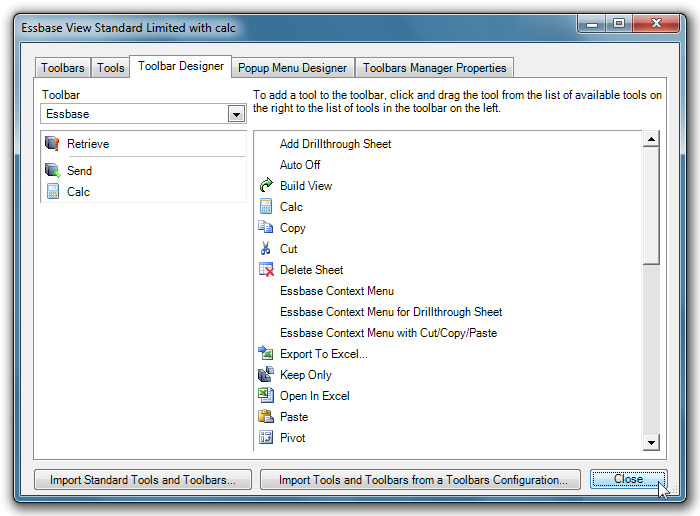
A list of additional Essbase tools, including the newly created Calc tool, display in the list on the right. Drag and drop the Calc _ tool to the left menu and place it below the _Send tool.
Close the Toolbar Designer.
Configure Tools
Click Configure Tools to open the Configure “Essbase View Standard Limited with calc” Tools dialog.
From the Module drop down menu select CustomToolControllers.
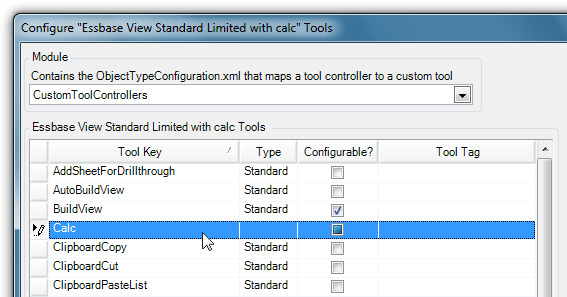
Highlight the Calc tool row in the Tool Key column and the properties display on the right.
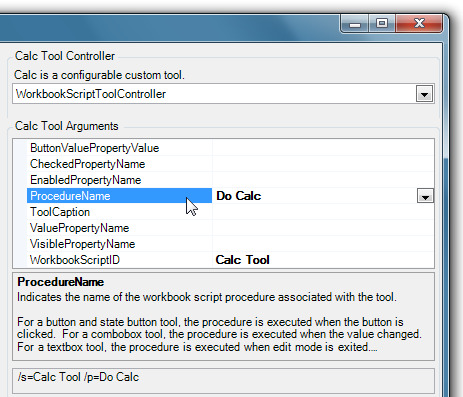
In the Calc Tool Arguments properties, set WorkbookScriptID to Calc Tool and ProcedureName to Do Calc.
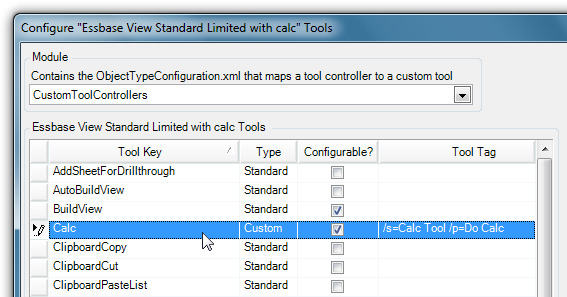
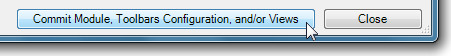
Click on Commit Module, Toolbars Configurations, and/or Views and then click Close.
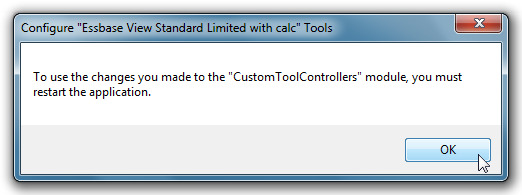
In order to view or use the changes just made to this Module, the application must be restarted. Click OK to accept the following dialog.
Editing Toolbar Settings in a View
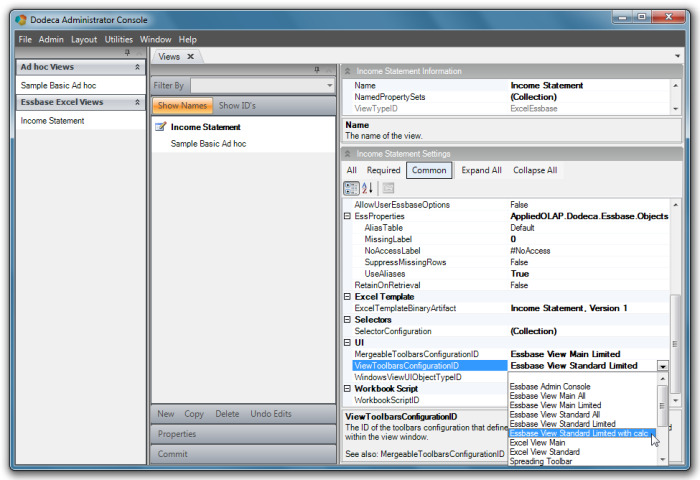
Now that the Essbase View Main Limited with calc configuration is complete, it is necessary to go back to the Income Statement View and set the ViewToolBarsConfigurationID property. Select the Essbase View Standard Limited with calc from the dropdown menu. Commit the changes.
To test the new toolbar configuration, open the Income Statement View. Be sure that the selectors are filled and click on the build icon. Make note that the new icon for the Calc tool displays on the toolbar. Click on the calculation tool. After the Essbase Run Calculation is performed, a message box displays confirming that the calculation was successful.